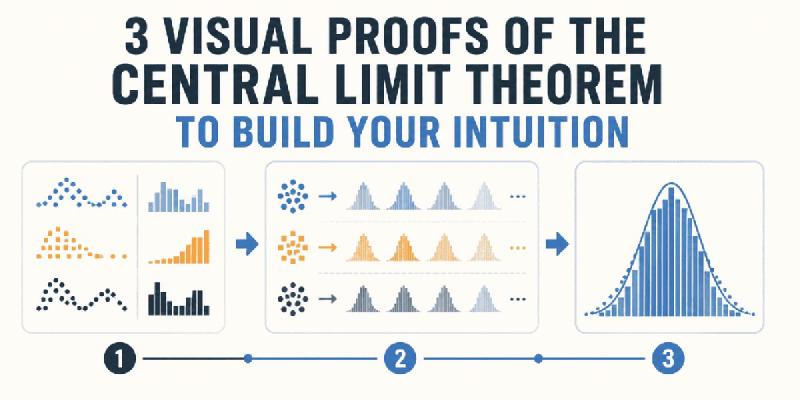
The central limit theorem explains why the famous bell curve appears so often. Even when the original data is uniform, bimodal, or heavily skewed, the averages of enough samples tend toward a normal distribution. 📊
The article builds intuition with three visual experiments. A single die produces uniform results, but the average of five dice forms a bell around intermediate values. A population of users who watch videos for either very little or a very long time also produces normally shaped averages when groups of 40 are sampled. Even income, usually skewed by a few extreme values, becomes smoother when groups of 50 are averaged.
💡 Explanation in a nutshell#
Extremes are difficult to repeat together: to get a very high or low average, many elements would need to deviate in the same direction. Balanced combinations are much more common. Repeating the sampling concentrates results in the center and draws a bell curve.
That is why the theorem is fundamental for estimating means, building confidence intervals, and applying statistical methods even when the original distribution is not fully known.
More information at the link 👇