Every data analysis starts with basic questions: how many rows are there, which columns are numeric, are values missing, and how are the data distributed? Solving them manually with repeated snippets takes time and makes consistent reporting harder.
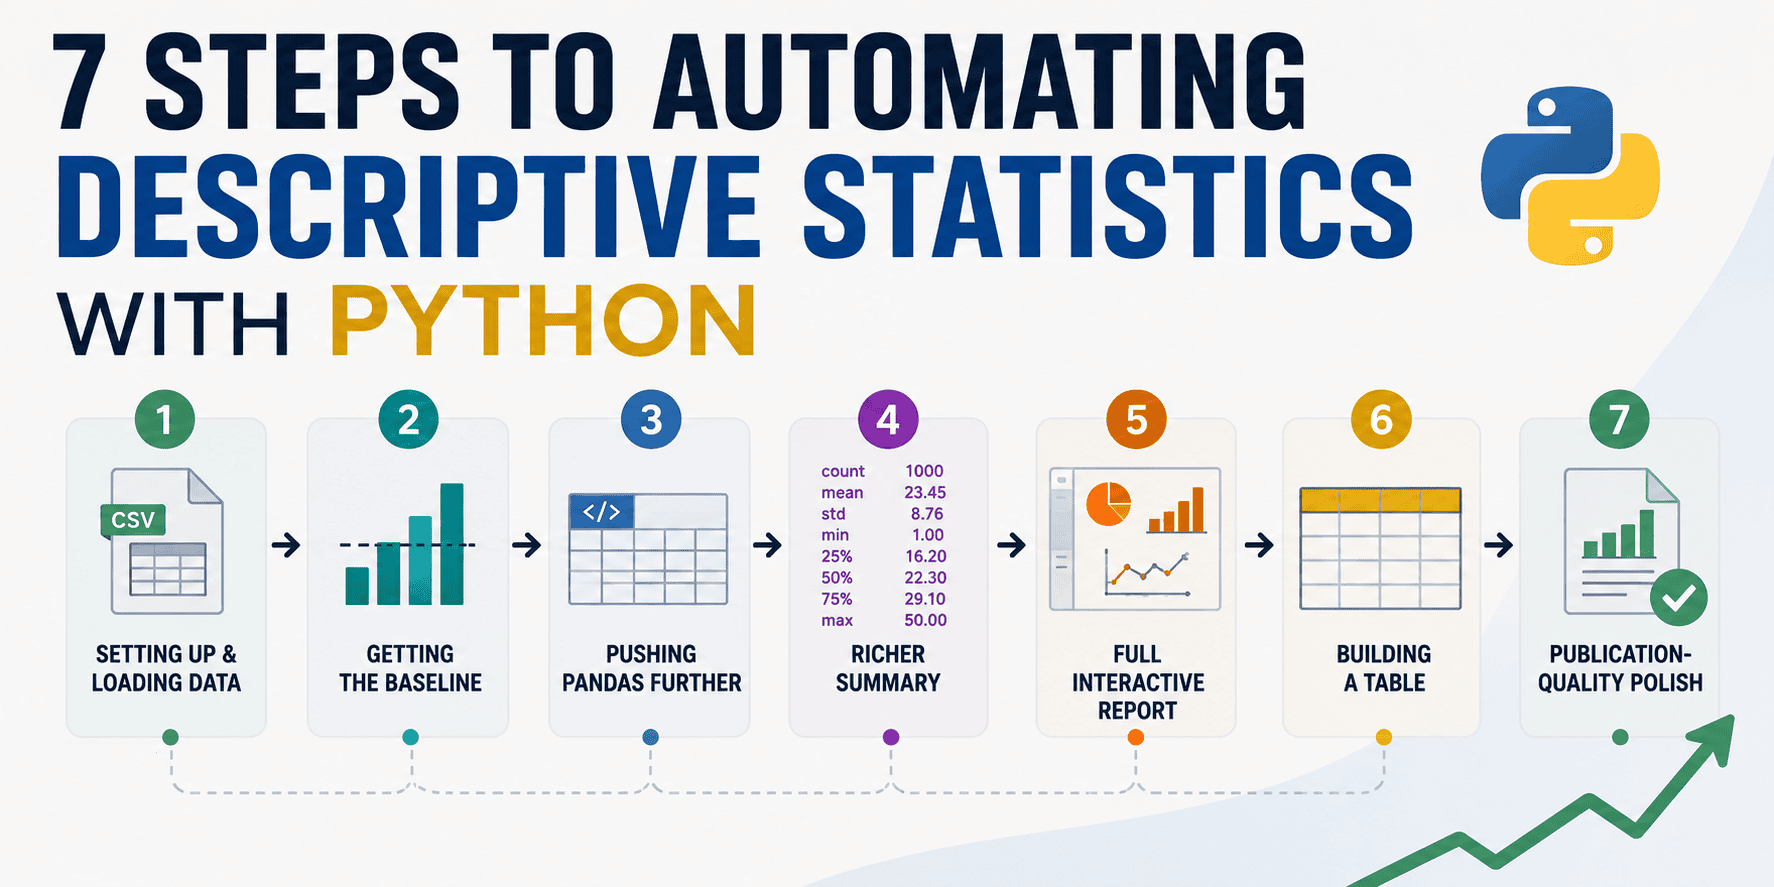
The article presents a ladder of Python tools for automating this work with the Palmer Penguins dataset 🐧.
🔹 Pandas provides describe(), agg(), and groupby() to quickly calculate means, medians, standard deviations, percentiles, skewness, and grouped summaries.
🔹 skimpy generates a one-call summary of a DataFrame’s structure, missing values, statistics, and small console histograms.
🔹 fg-data-profiling creates an interactive HTML report with distributions, correlations, duplicates, and data-quality alerts. In older projects, its predecessor was ydata-profiling.
🔹 tableone produces the “Table 1” used in research: stratified variables, missing values, p-values, and standardized differences.
🔹 Great Tables turns any summary into a polished table for reports, presentations, or documentation.
The author shows how to combine these tools into a reusable function, transforming a collection of snippets into a repeatable process.
💡 Explanation in a nutshell#
Start with Pandas for a quick review and choose more complete tools as needed. Automating summaries does not replace human judgment: you still need to decide how to handle missing values and which statistics make sense.
More information at the link 👇