📊 The Robust Data Scientist: Winning with Messy Data and Pingouin
Real-world data science is messy. 💥 Outliers, skewed distributions, and unequal variances constantly challenge classical statistical assumptions.
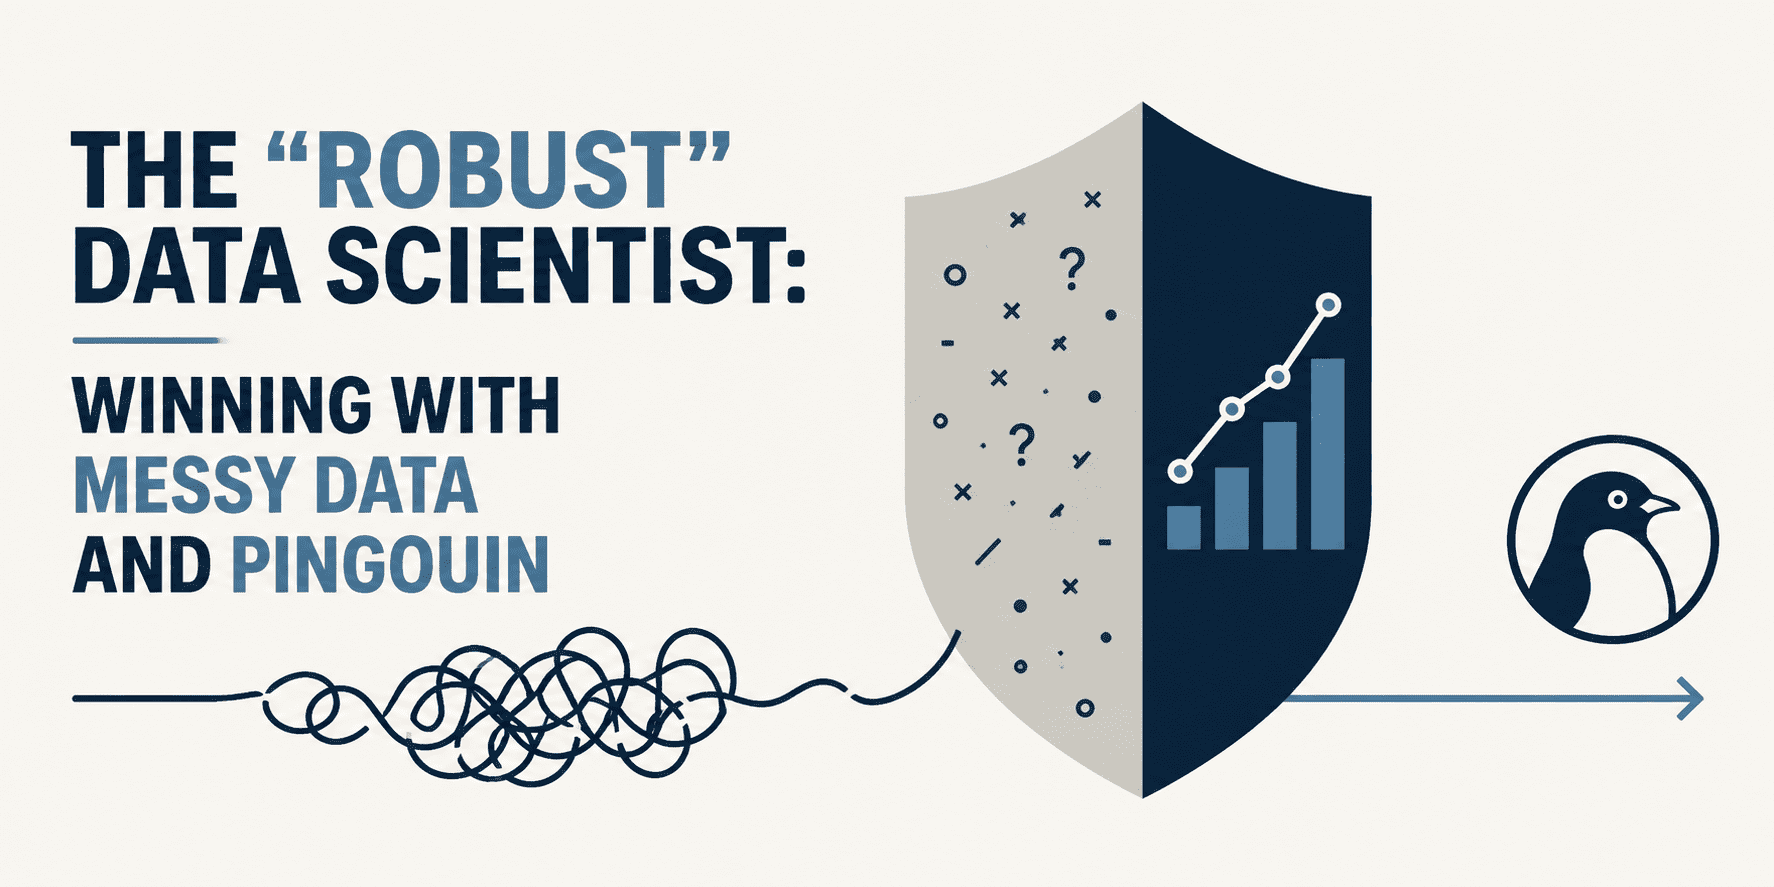
This article presents a “choose your own adventure” approach with three scenarios using 🐧 Pingouin (Python stats library):
🔹 Adventure 1 — Normality test fails: T-tests become unreliable. Fix: Mann-Whitney U test, which compares ranks instead of means — immune to outliers.
🔹 Adventure 2 — Paired t-test fails: Non-normal differences between paired measurements mislead confidence intervals. Fix: Wilcoxon Signed-Rank test, the rank-based sibling of the paired t-test.
🔹 Adventure 3 — ANOVA fails: Unequal variances across groups skew classical ANOVA results. Fix: Welch’s ANOVA, which penalizes high-variance groups to level the playing field.
Each scenario is illustrated using the wine quality dataset and Pingouin’s concise API — just a few lines of Python to swap a fragile test for a robust one.
💡 Explanation in a nutshell#
Imagine comparing two groups of data. Normally you’d compare their averages, but extreme values (outliers) can distort those averages. Robust statistics are mathematical techniques designed to still work correctly even when data is “messy” — they minimize the influence of outliers and don’t assume data follows a perfect bell curve.
More information at the link 👇