📊 The best visual guide to linear regression you’ll find — 100+ images and 33 animations
This article by Mikhail Sarafanov took more than a year to write. And it shows.
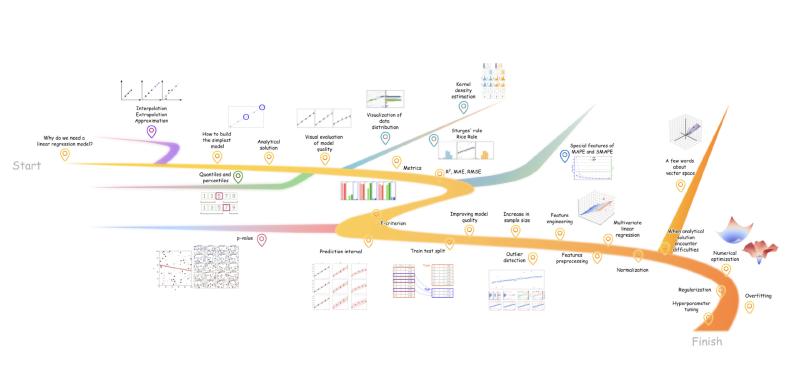
🎯 What it covers:
- Why we need models — from raw data to useful predictions
- Simple regression:
y = b₀ + b₁·x— what the intercept and slope mean - Least squares — how to find the best line analytically
- Evaluation metrics: R², RMSE, MAE, MAPE
- Multiple regression — predictions based on many variables
- Gradient descent — when the analytical solution isn’t practical
- L1/L2 Regularization — how to avoid overfitting
- Cross-validation — ensuring the model generalizes well
✨ What makes it special:
- Designed so you understand it just by looking at images and animations
- All code is open source and reproducible in Python
- Narrative structure: each step solves the problem that emerged in the previous one
💡 Explanation in a nutshell#
Linear regression is like drawing the best straight line through a cloud of points on a graph. If you have apartment prices by size, regression gives you the formula to predict any apartment’s price. It’s the starting point for all of Machine Learning.
More information at the link 👇

Also published on LinkedIn.