🔍 AssociationExplorer: explore associations between variables without writing a single line of code#
Do you work with data and need to understand relationships between variables, but don’t want to code? AssociationExplorer is a Shiny application for R, recently published on CRAN, that makes this possible visually and interactively.
What does it do?#
Following a simple guided workflow:
- 📂 Import data in CSV or Excel format
- 🔢 Interactively select variables of interest
- 📊 Automatically compute association measures based on variable type:
- Pearson’s \(r\) correlation (numeric–numeric)
- Cramer’s V (categorical–categorical)
- Correlation ratio \(\eta\) (numeric–categorical)
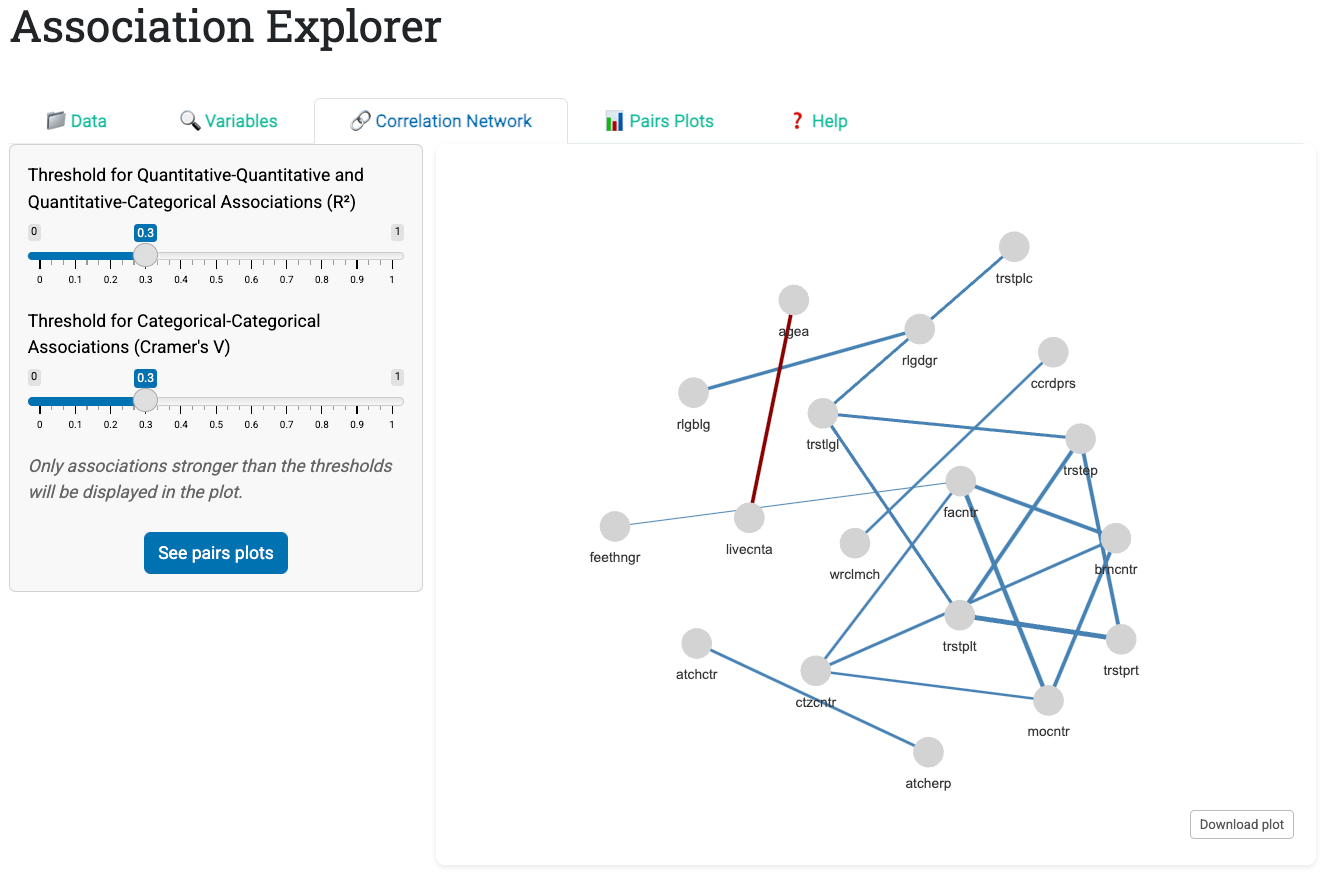
- 🎚️ Filter associations using user-defined thresholds
- 🕸️ Visualize results through an interactive correlation network and bivariate plots
Who is it for?#
It is designed for data journalists, teachers, students, researchers in the exploratory phase, and curious citizens looking to understand public datasets or surveys — all without writing any code.
Simple installation from R:
install.packages("AssociationExplorer2")
library(AssociationExplorer2)
run_associationexplorer()
🪄 Quick explanation#
Imagine you have a spreadsheet with survey data and want to know which variables are related to each other. Normally, this requires code and statistical knowledge.
AssociationExplorer is like a visual assistant: load your data, select columns, and the app automatically shows you which variables are connected and how strongly.
👉 No code. No formulas. Just data understanding.
More information at the link 👇